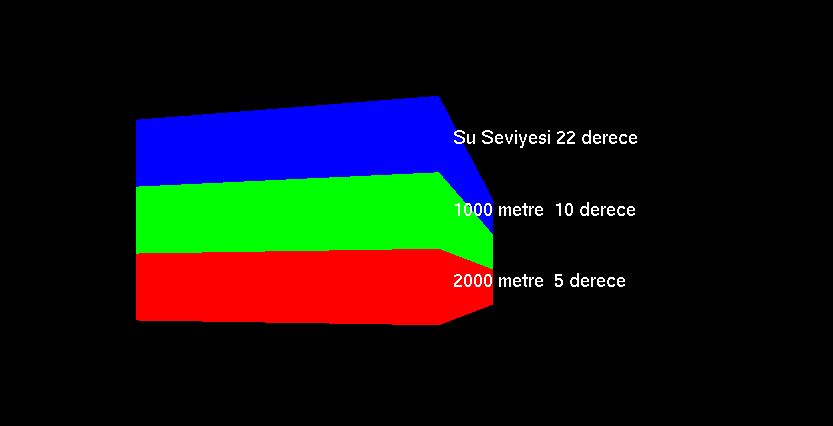
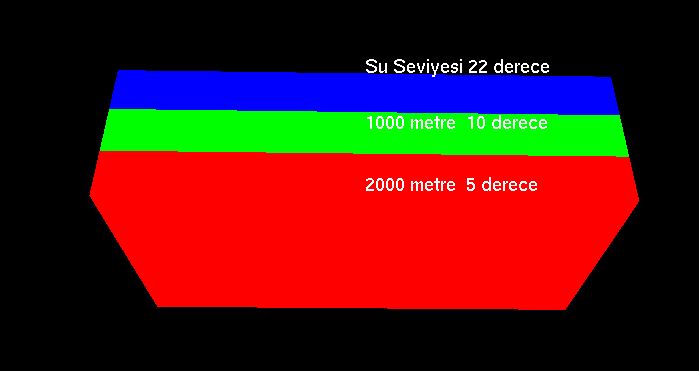
OpenGL Ocean Layer Temperature Levels Visualization Application
Hello everyone. This application was developed to display temperature levels of ocean layers using OpenGL 3D features. You can follow my Github account for the source code:
Technologies Used
- C++
- OpenGL
OpenGL
OpenGL is a leading system for developing portable 2D and 3D graphics applications. Since 1992, it has been a programming interface that supports 2D and 3D in the industry and serves a very wide computer network. OpenGL provides fast application development for mapping with special effects and powerful visual functions.
Running the Project
To run the project, we need to obtain Visual Studio as the environment. Then we have GLU/GLUT libraries that we need to download and add externally. You can access them from the link here. After downloading the file, we first need to copy and paste the ".dll" extension files from within the file into the folder at C:\Windows\System32 file path.
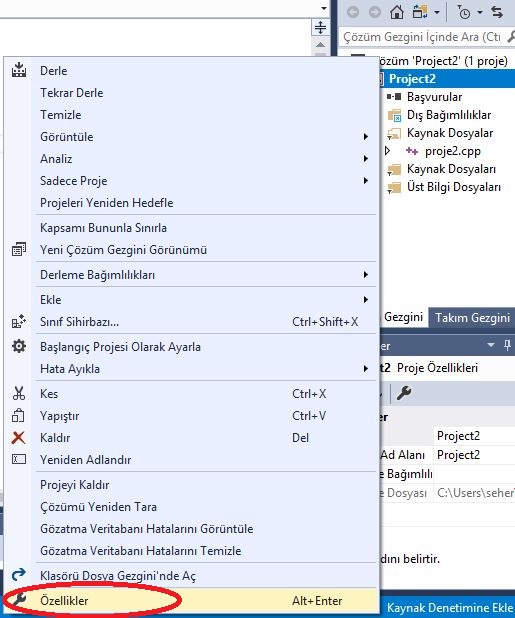
Then, after starting the project with Visual Studio, we right-click on the project in the section on the right side and enter the Properties section.
On the screen that appears here, we enter the Additional Include Directories option in the General section of the C/C++ option and add the include files separately from within the downloaded file directory.
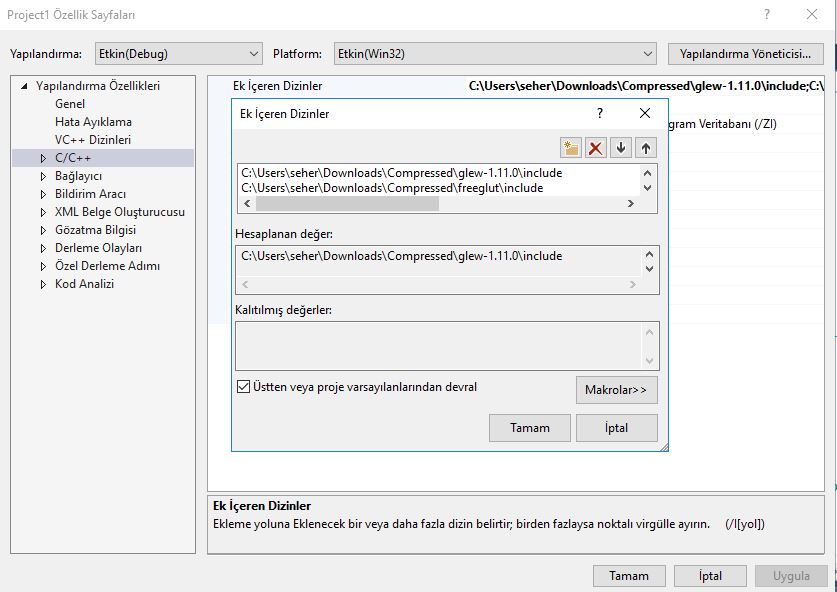
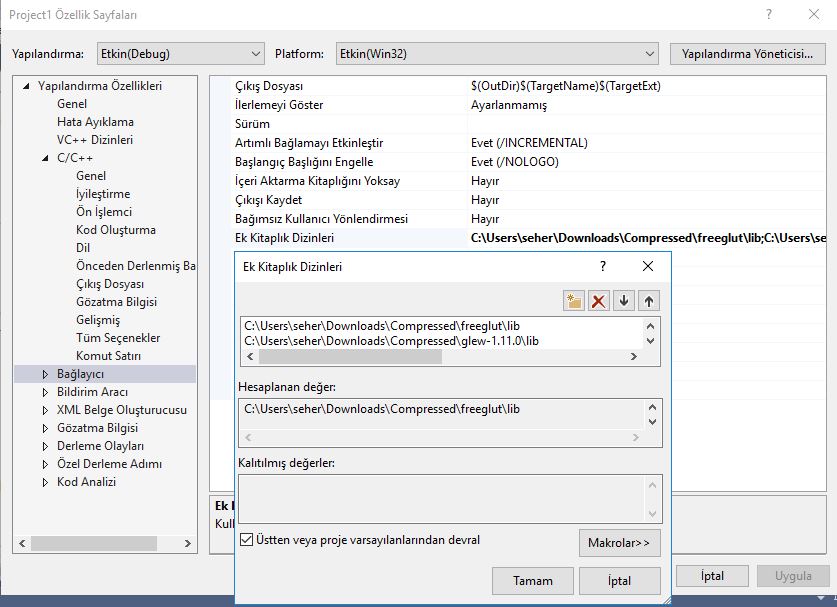
Secondly, we enter the Additional Library Directories option in the Linker section and add the lib files separately from within the downloaded file directory.
After all the addition operations, we can run our project. After pressing the Run button, we can control the graph that appears in the interface by using the mouse and keyboard to change its movement and positions.